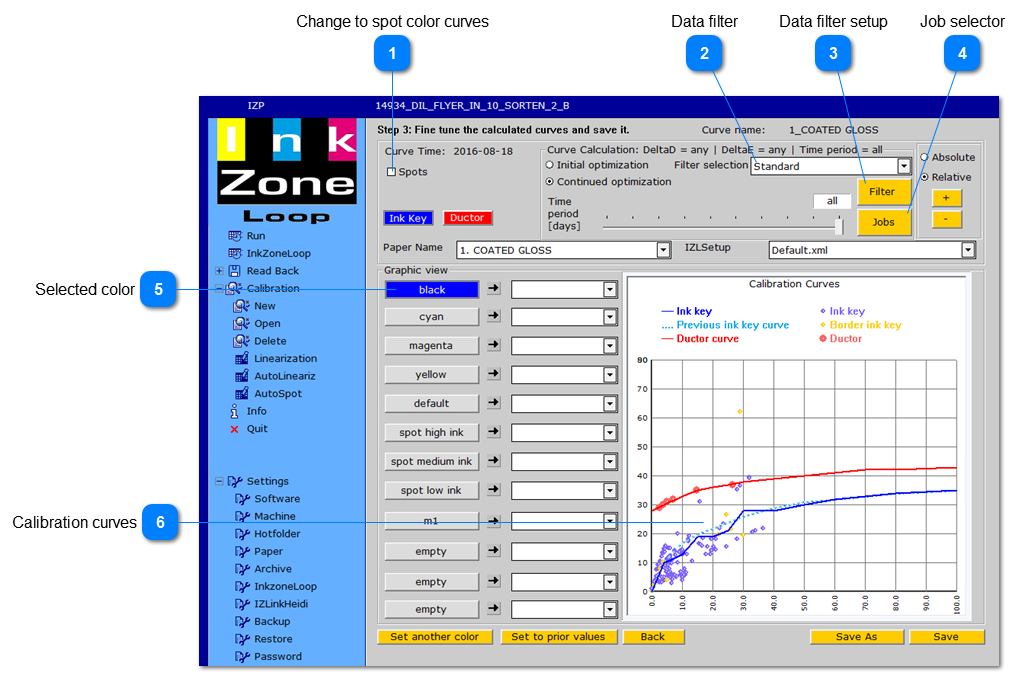
3.1.1. Linearisation Curve - Base Window
|
Access the linearisation window from the menu on the right.
|
|
 Change to spot color curves |
 Data filterThe selected filter helps to refine the data by the parameters:
1. Density difference"
2. Delta E
3. Production time
|
 Data filter setup |
 Job selector |
 Selected colorSelect from here a color to inspect the calibration curve and its adjustment
|
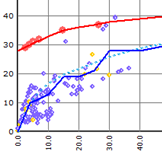
 Calibration curvesCalibration curves with job data (purple dots).
Dotted light blue line represents the existing curve shape.
Blue line shows the new curve shape adjusted by job data.
Red curve indicates ductor/sweep.
|