To properly display this page you need a browser with JavaScript support.
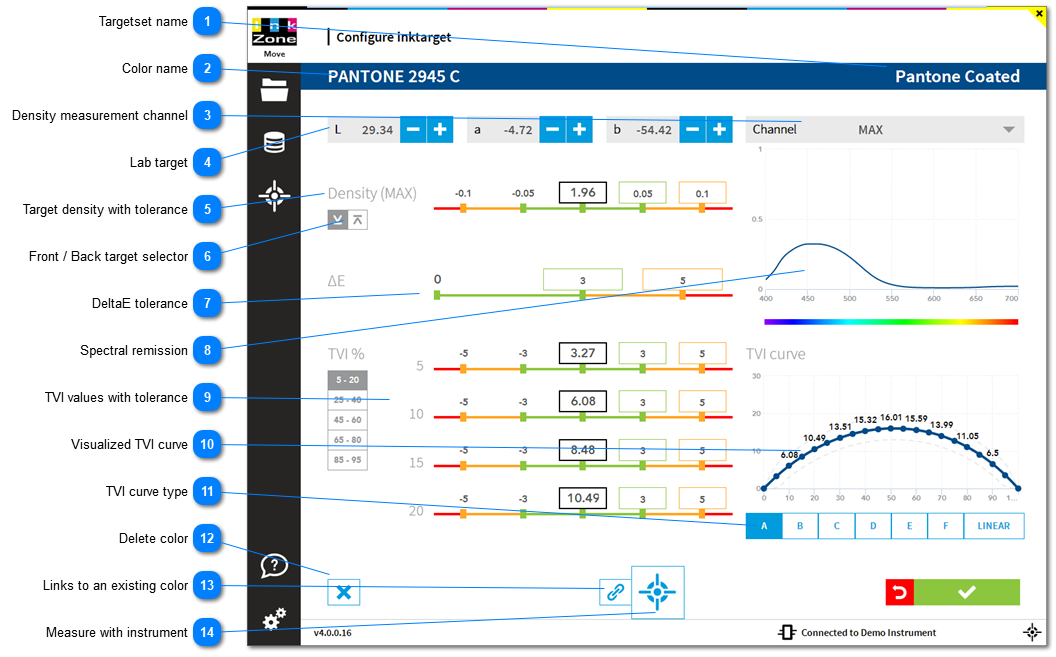
Targetset name The spot color targetset where the color is assigned to
Color name Color name
Density measurement channel Usually the density filter channel for measuring a spot color with a spectrophotometer is set to MAX, meaning the maximum peak from its remission. Nevertheless, it is possible to change the filter to K, C, M or Y
Lab target Lab target value
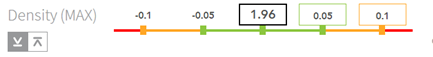
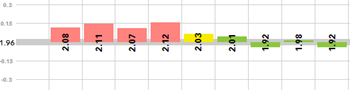
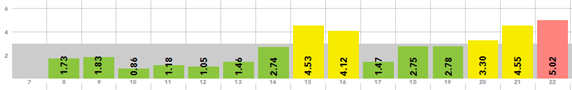
Target density with tolerance Target density with tolerance
With this setup the density for a front side measurement is displayed as:
< 1.86
red
1.86 - 1.90
yellow
1.91 - 2.01
green
2.02 - 2.06
yellow
> 2.06
red
Front / Back target selector Setup an individual density target for front and back side.
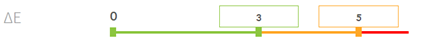
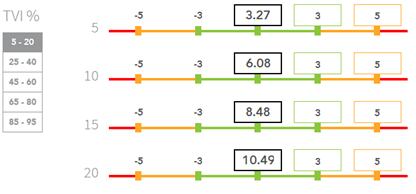
DeltaE tolerance Color tolerance in DeltaE
With this setup the DeltaE for a front and back measurement is displayed as:
0 - 3
green
3.01 - 5
yellow
> 5
red
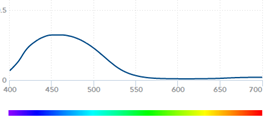
Spectral remission Spectral remission curve
TVI values with tolerance TVI curve values and their tolerance
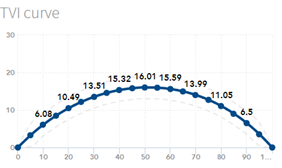
Visualized TVI curve Visualized TVI curve with the TVI expected value for 5 to 95%.
TVI curve type ISO 12647-2 uses different sets of predefined TVI curves named A to F.
A linear curve is when the dot gain is expected like
5%Tone TVI=5;
10%Tone TVI=10;
etc.
Delete color Deletes the color
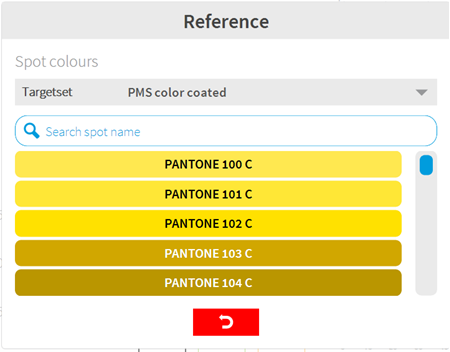
Links to an existing color Create a link to an existing spot color.
Select the reference color in the dialog. Use the search to filter the color list.
Measure with instrument Place the instrument on the sample and start the color reading with this button. Alternatively, use the instrument measurement button.