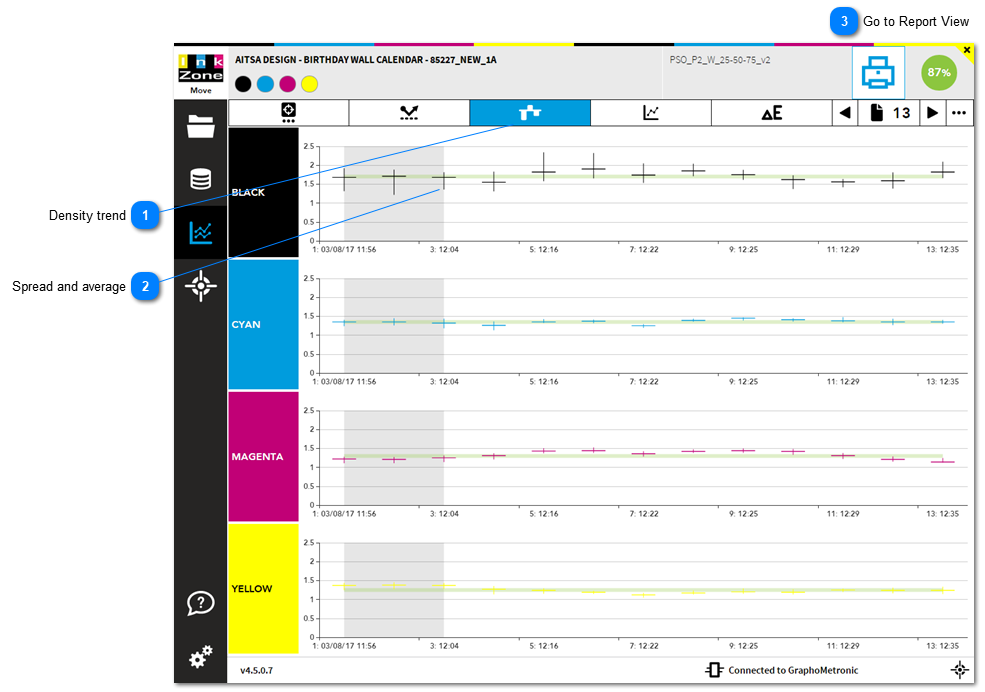
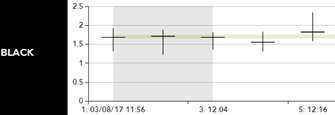
1.4.2.5. Trend on Density
A density trend graphs displays the spread and average density for every measurement.
 Density trendThe density trend graphs displays the spread and the average density for every measurement.
|
|
 Spread and averageIndicates average density (horizontal) and spread (vertical).
Example:
Measurement number 5 has an average of 1,8 and a density spread
from 1.55 to 2.40 which is the lowest and highest density
reading from the black color.
|
|
 Go to Report View |
|