To properly display this page you need a browser with JavaScript support.
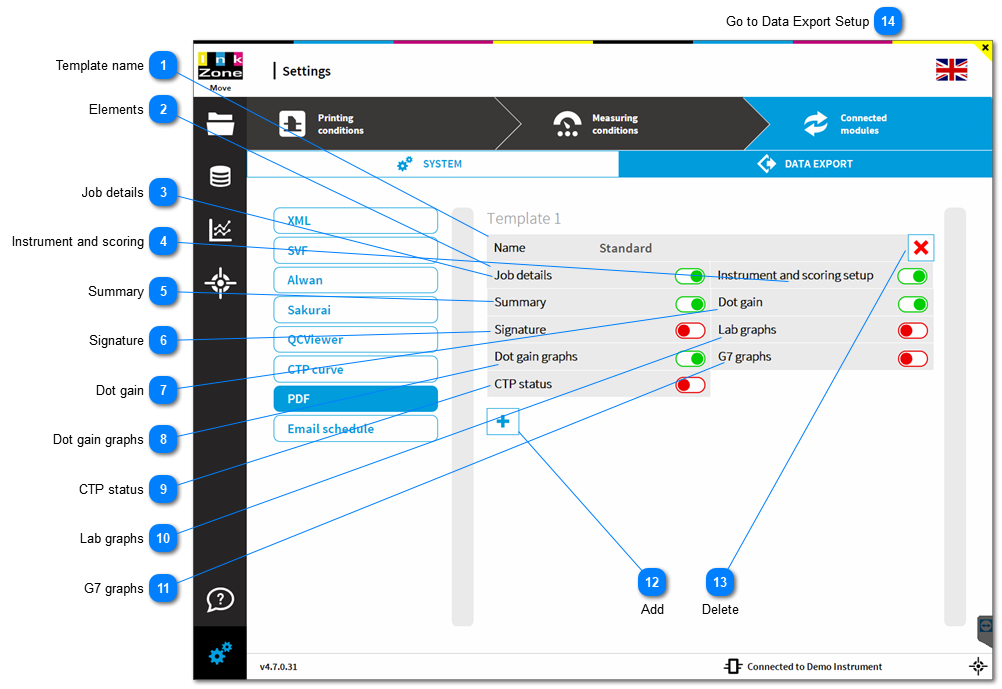
1.2.8.8. PDF Report Template
Template name Define a template name. The template can be selected when creating a PDF.
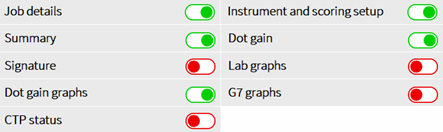
Elements Set the template item to active to include it to the PDF report print out.
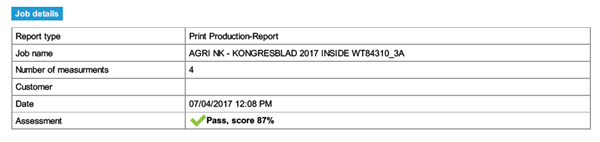
Job details Template item Job details Adds job information, including the total score, to the PDF report:
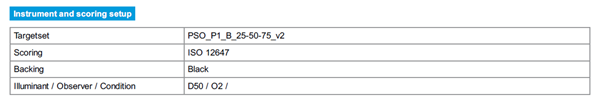
Instrument and scoring Template item Instrument and scoring
Adds scan instrument the print standard targetsset to the PDF report:
Sample:
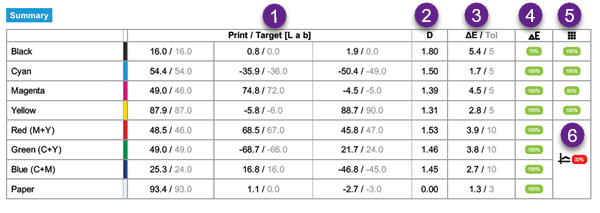
Summary Template item Summary
Adds a table with color and TVI assessment to the PDF report.[1] Print / Target [Lab] : printed value in bold, target values in light color tone
[2] Density : target density
[3] Delta E / Tolerance : deltaE of printed color in bold, accepted tolerance for assessment in light color tone
[4] Delta E score : scores for deltaE with the selected scoring set
[5] Dot gain score : scores for dot gain values with the selected scoring set
[6] Midtone spread: scores for mid-tone spread
Sample:
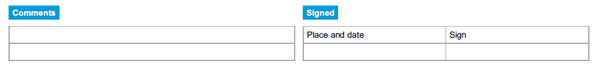
Signature Template item Signature
Adds at the bottom of the PDF report a customer sign-off element.
Sample:
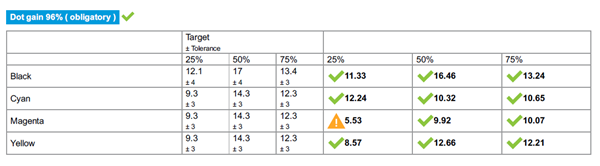
Dot gain Template item Dot gain
Adds dot gain information to the PDF report.
Sample:
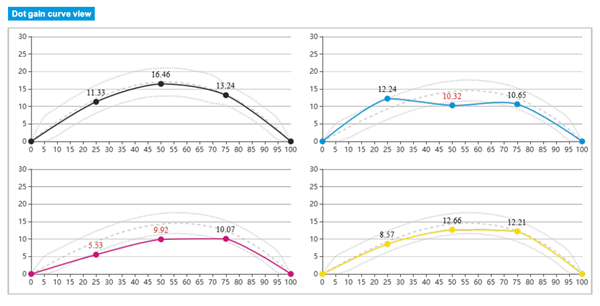
Dot gain graphs Template item Dot gain graphs
Adds dot gain graphs to the PDF report.
Sample:
CTP status Template item CTP status
Adds information about data exported by InkZoneTVI to the PDF report.
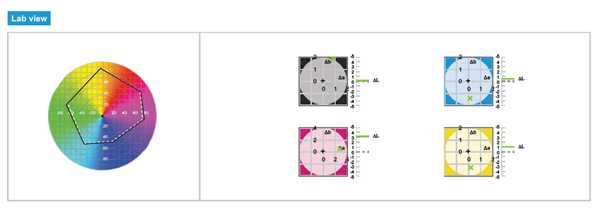
Lab graphs Template item Lab graphs
Adds a color gamut circle to the PDF report.
Sample:
G7 graphs Adds a G7 graphs to the PDF report.
Add Creates a PDF template which is available during PDF report creation.
Delete Delete the PDF template.
Go to Data Export Setup